Welcome back y’all. If you didn’t catch part I of this analysis, check it out!
In part II we are going to explore the good stuff: total production. By the end of this post you’ll be able to report not only on the careers of Spittin Chiclets guests, but also have some statistical analysis to brag about to boot.
Your author also reminds you that the data used here was scraped as best as possible. Unfortunately, we weren’t able to capture everyone, but most players and goalies are accounted for.
A reminder: if you don’t listen to the podcast, you’ve got to fix yourself.
Draft Year of Show Guests
Since your author forgot to include this beauty in part I here is a look at the distribution of guests by draft year.
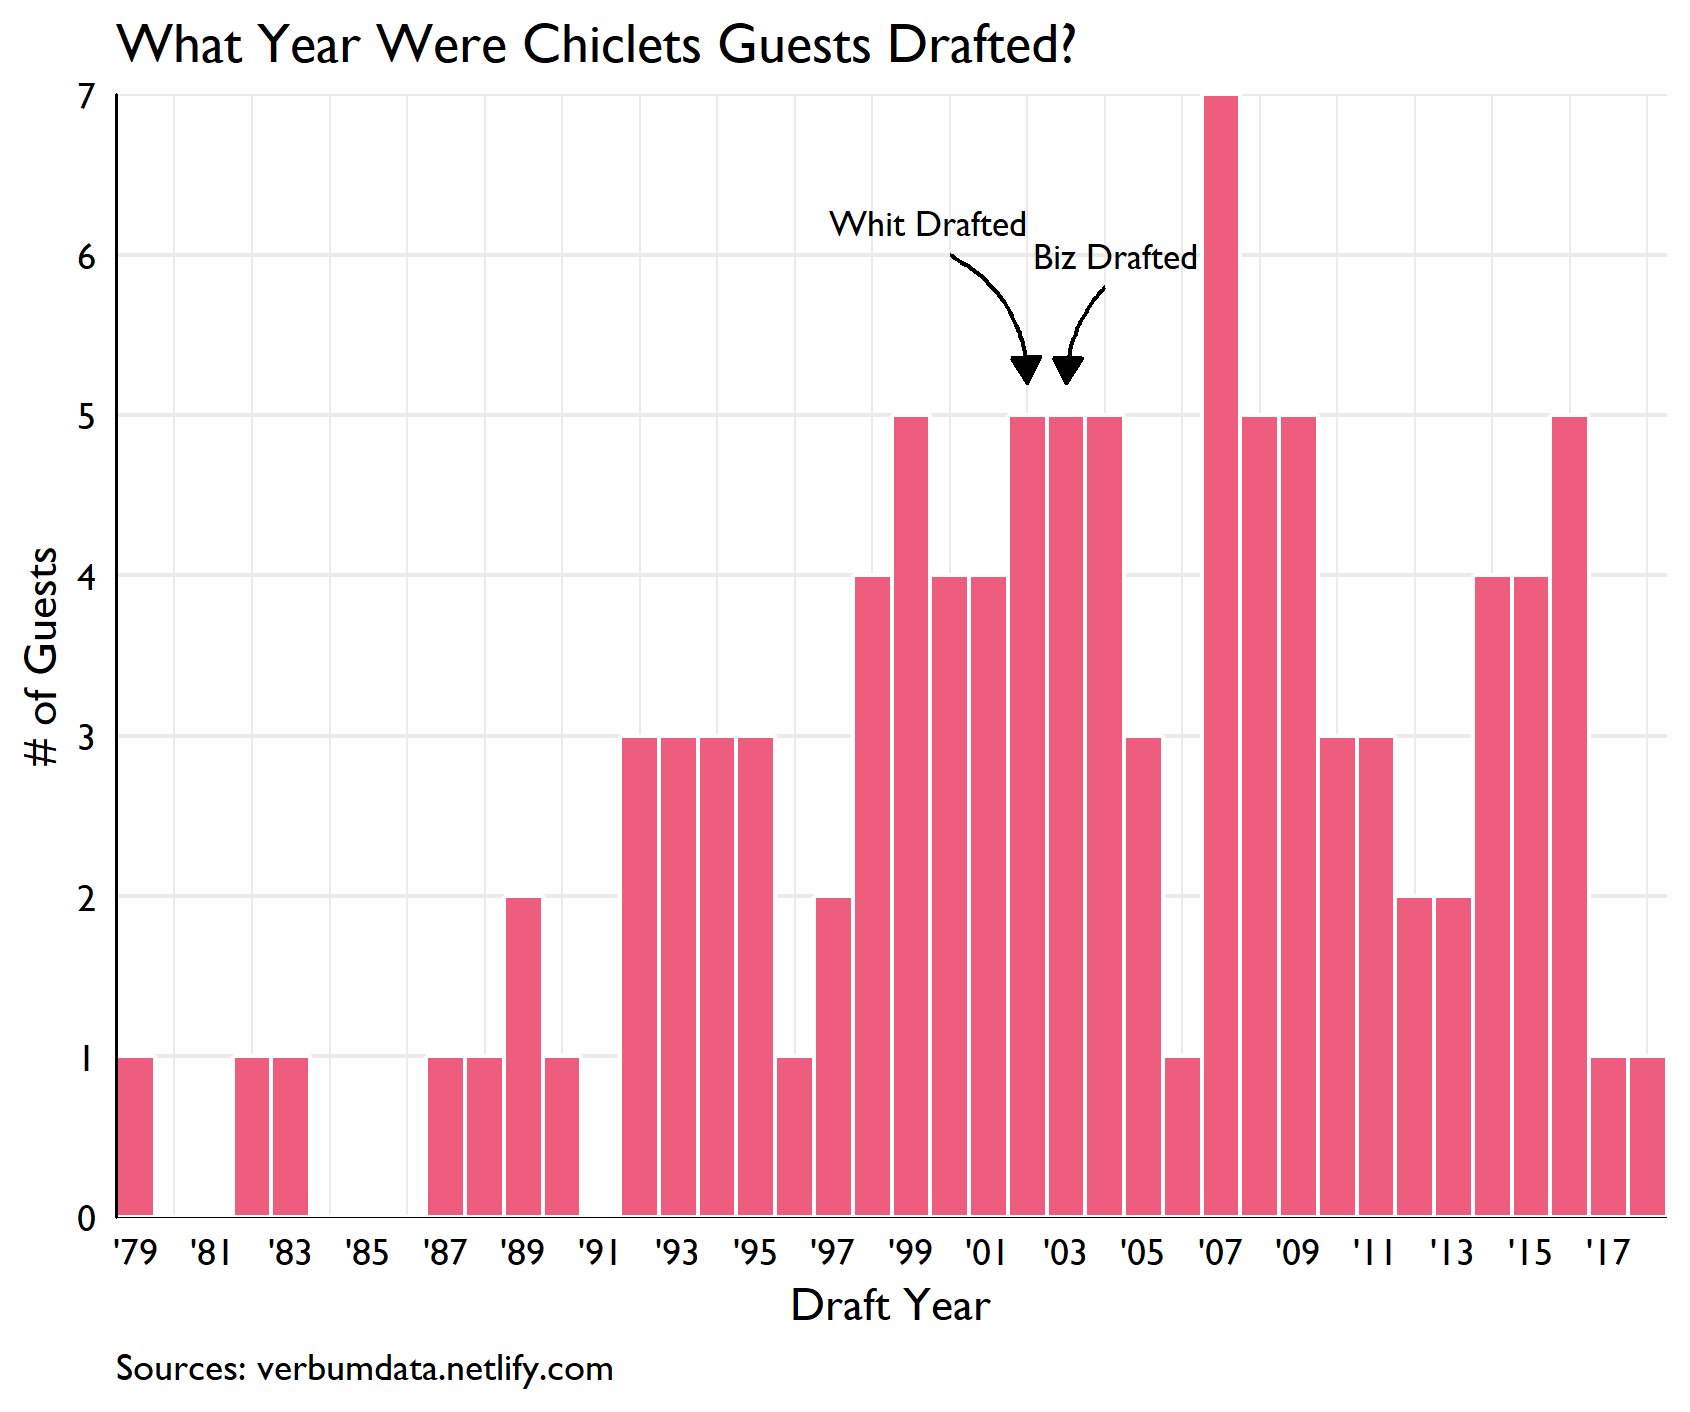
No surprise that the years near Biz and Whit’s draft dominate. Terry Ryan Sr. probably takes the cake for the oldest guest on the list, but we didn’t include him in the scraping. By the way, if you haven’t met Terry Ryan Sr., you haven’t lived.
Position Player Leader Board
Next up boys is the grand standing leader boards. Position players, as usual, get the glory and go first.
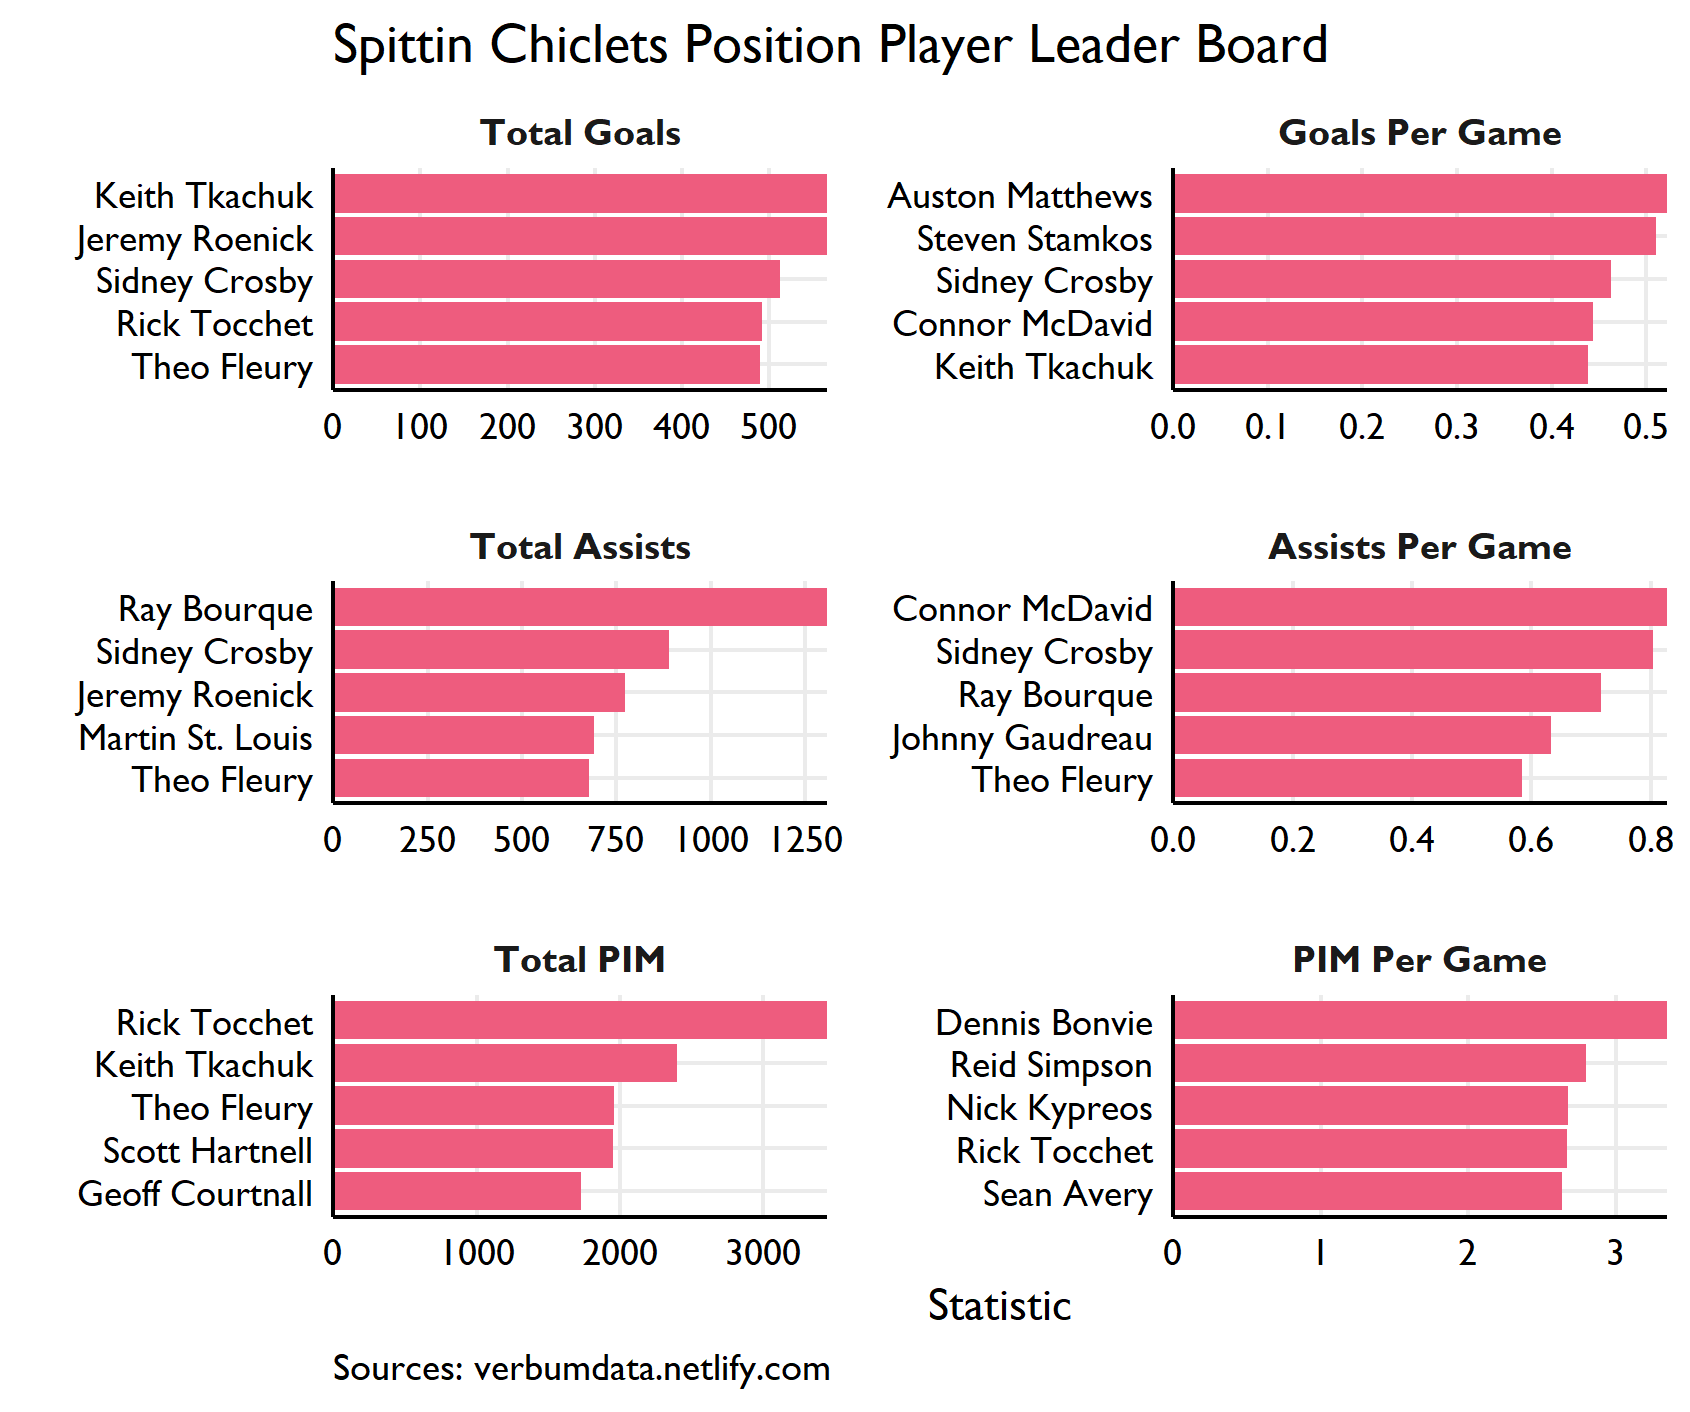
Where to begin? First let me hit you with the surprises.
I’m a young whipper snapper and so didn’t get to appreciate Keith Tkachuk in his prime. BUT WOW. What a stud! Absolutely dominant. Not only is he top 5 in career goals per game, but he also holds 2nd place for career PIM among Chiclets guests. Rick Tocchet is also a monster beast I wish I saw more of during his reign of terror.
Now we can address the expected. Sid the Kid is a true legend. Stammer is a monster on the goals per game metric. Don’t sleep on Ray Bourque though. The haas is the all-time Chiclets leader in assists.
Wanna get statistical, mystical
Given your author’s own interests, a bit of stats really makes the data sing. In the plot below, I show total points per game against total games played. Details on the regression are after the highlights.
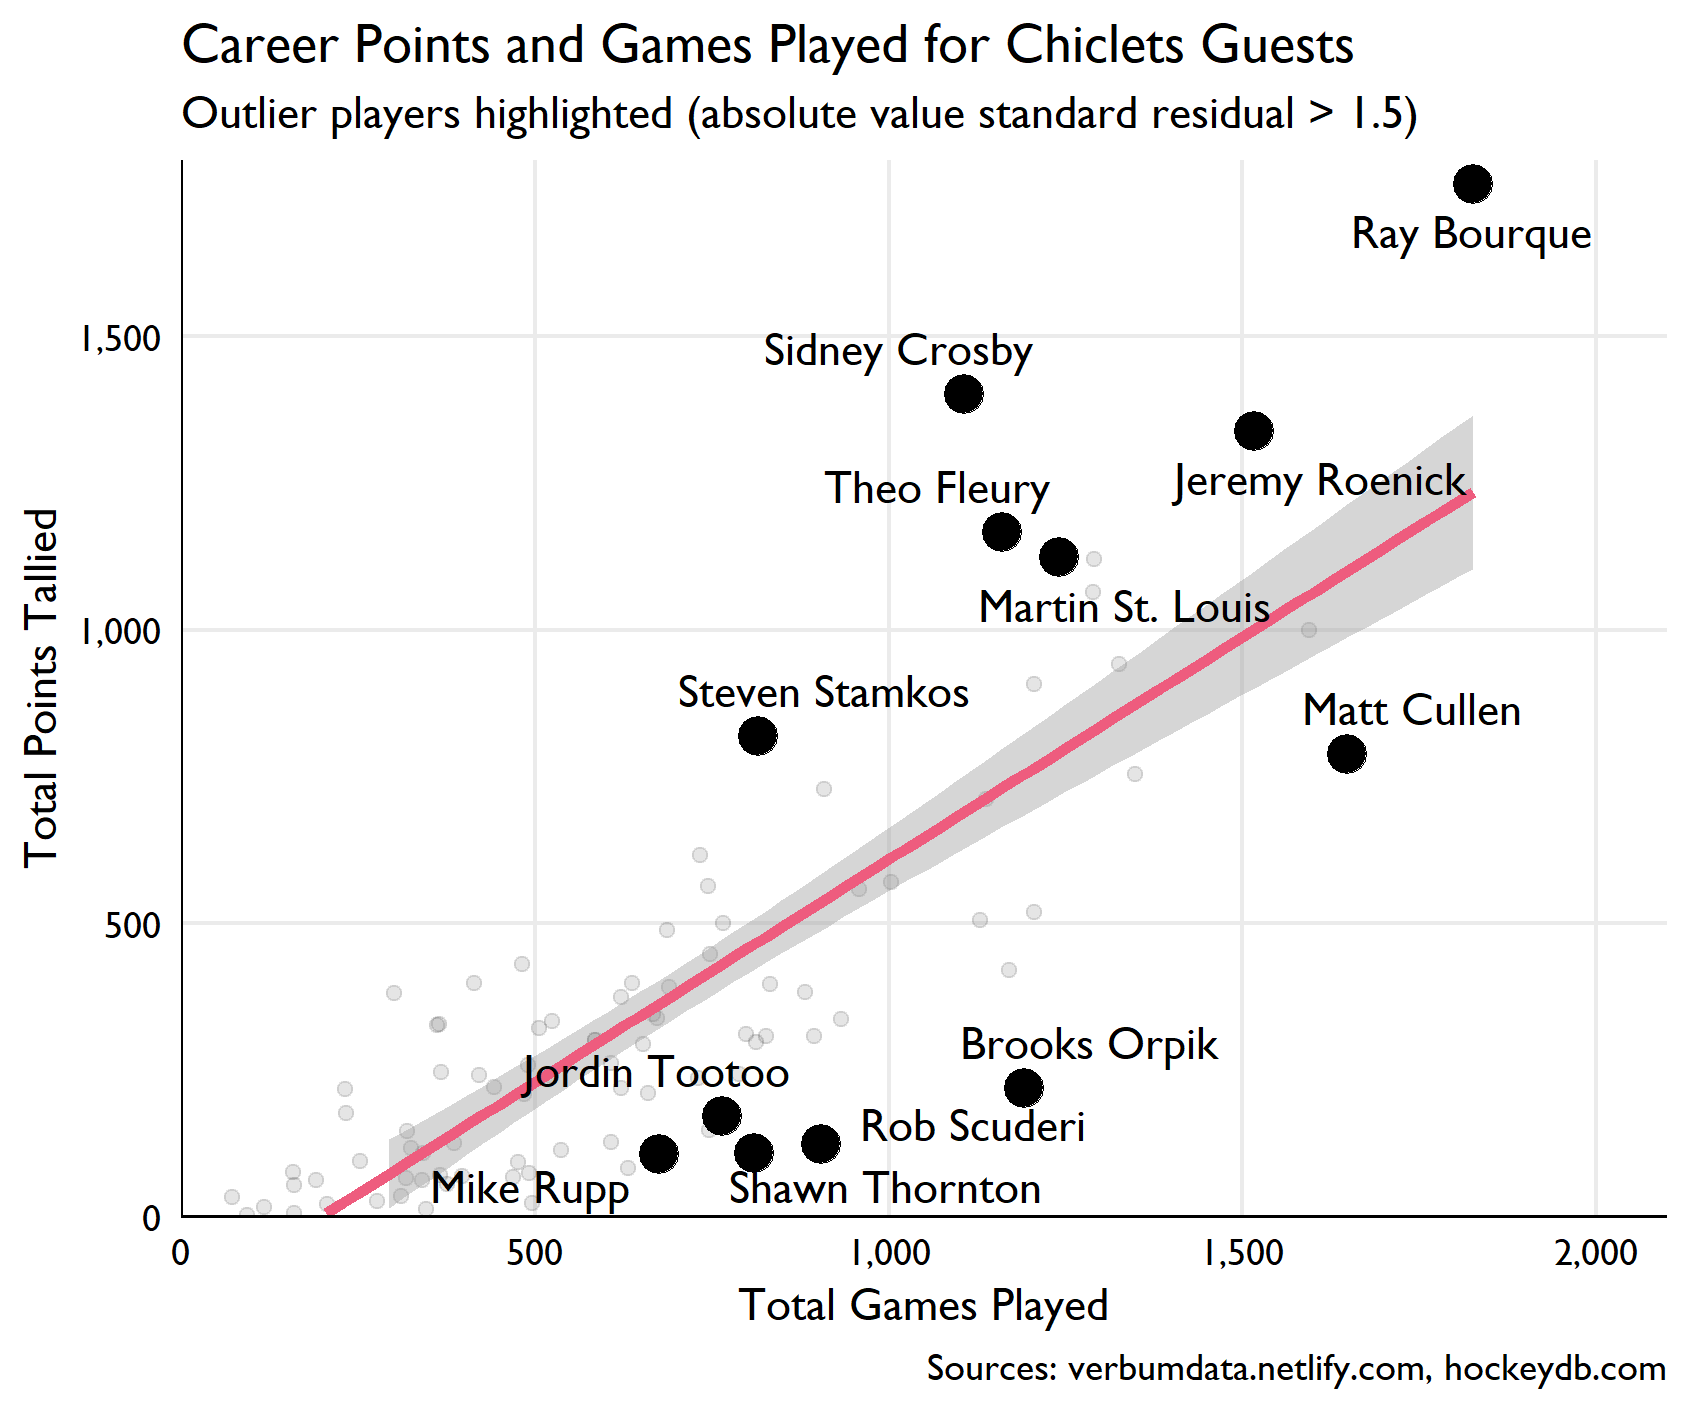
This thing is beautiful to me. All the highlighted players are outliers in one way or another so let’s start there.
Once again, Ray Bourque is a legend. He played 1,826 games and tallied 1,759 points.
Sid the Kid cannot be stopped. He is an extraordinarily unusual talent, even among the universe of Chiclets guests. He registers the highest standard residual at 3.52!!! (see below for explanations)
You’ll see a few D men below the regression line. No surprise, given these talented hogs notched boat loads of games played without monster point production.
Now…for the non-math inclined, feel free to skip the next piece.
For the regression, we are interested in understanding the variation in total points as a function of games played AND whether or not the player was a defensemen. Here are the regression statistics.
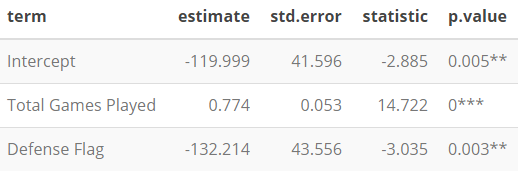
Unsurprisingly, both the number of games played and the defensemen flag are highly significant.
Last, But Not Least, The Goalies
Where would a Chiclets guest adventure post be without a look at the goalies. They don’t get the same love as the position players, but they won’t be overlooked here.
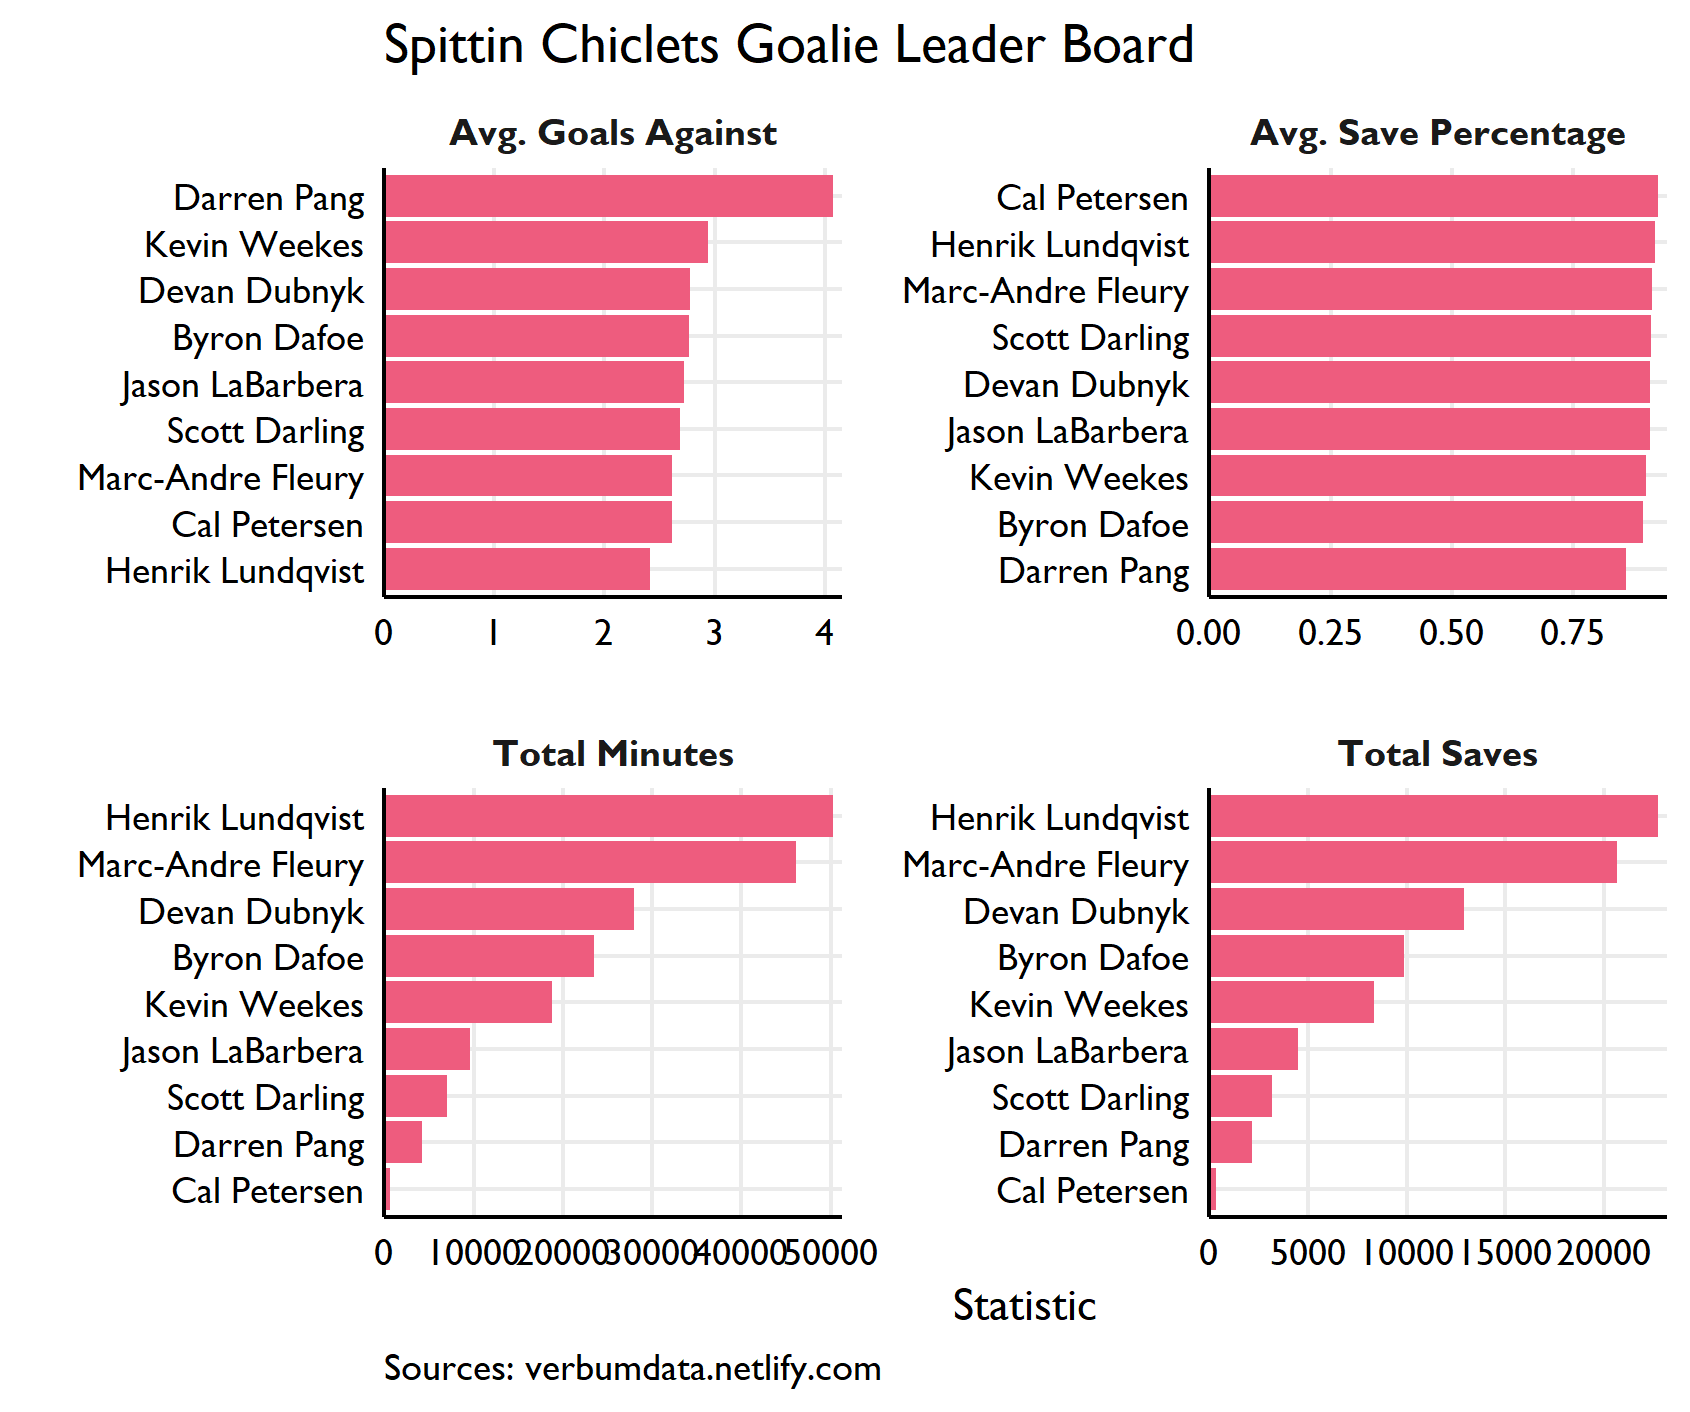
This plot suffers a bit from sample size. Cal Petersen looks incredible on the average metrics given we only have one year in the database. But my oh my, look at Henrik Lundqvist and Marc-Andre Fleury. These two beasts cannot be stopped! Rockets on and off the ice.
That wraps up part two of the adventures. Tune in soon for a final post with some of the methods used to grab and process all the data.